- Home
- News & Analysis
- Weekly Summaries
- Weekly Summary: Rising Virus Cases and Volatile Trading
Weekly Summary: Rising Virus Cases and Volatile Trading
June 26, 2020By Deepta Bolaky
 @DeeptaGOMarkets
Rising Virus Cases
As of writing, the number of coronavirus cases worldwide has passed 9.7 million and is expected to reach 10 million by the end of this week as per the World Health Organisation. Europe and the US were among those countries that have seen a surge of COVID-19 cases since they began easing restrictions. The growing fears of a second wave of the outbreak have taken the markets on a volatile ride this week.
Stock Market – Swings
Risk sentiment remains fragile as investors are struggling to assess the surge in coronavirus cases and the impact on the very early stages of the global economic recovery. The flare-ups across the US, Germany, Australia, India, Indonesia and Brazil are worrisome. Stock market swung between gains and losses throughout the week as the rising virus cases dampened sentiment.
World Equity Indices
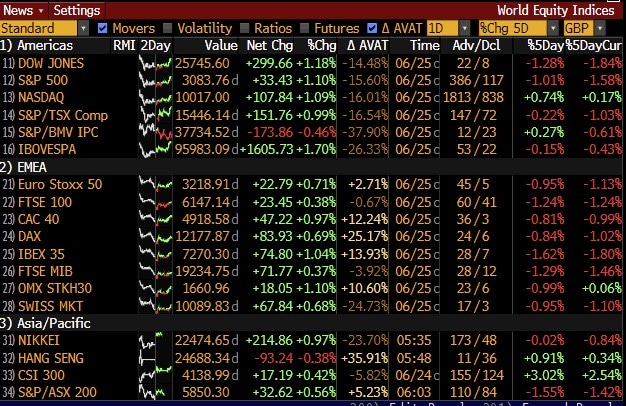
Source: Bloomberg
US Share Market
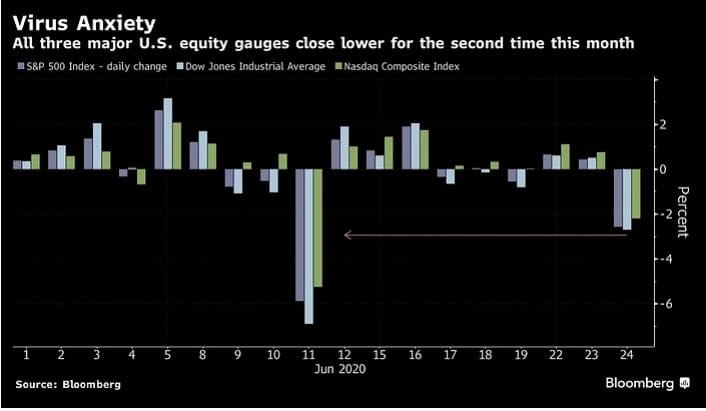
After a buoyant start to the week where major US indices were climbing higher, the sentiment has faltered mid-week due to virus concerns. Nasdaq has even hit record high earlier this week bolstered by leading PMI indicators showing a pick-up in business activities and talks of further stimulus.
On Wednesday, all major US equity benchmarks retreated significantly for the second time this month:
Australian Share Market
Similarly, the Australian share market dropped by around 2.5% on Thursday following poor leads from Wall Street. The index is poised to end the week in negative territory. As of writing, almost all sectors were in the red for the week. On Friday, the Australian share market has recovered from Thursday’s losses lifted by the gains in the US markets, but it is unlikely that the ASX200 will recover from the weekly decline.
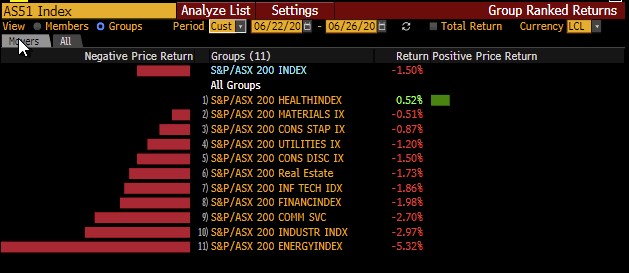
Source: Bloomberg
Forex Market
In the forex market, the US dollar gathered strength against major currencies as virus fears gripped markets. Safe-haven currencies like the Swiss franc and Japanese Yen were the least impacted while commodity-linked currencies were among the worst performers.
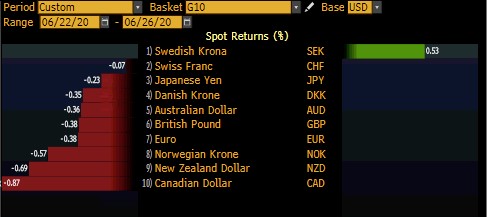
Source: Bloomberg Terminal
The greenback is also finding some support on improving economic data:
- Chicago Fed National Activity Index: The Index was 2.61 in May, up from –17.89 in April.
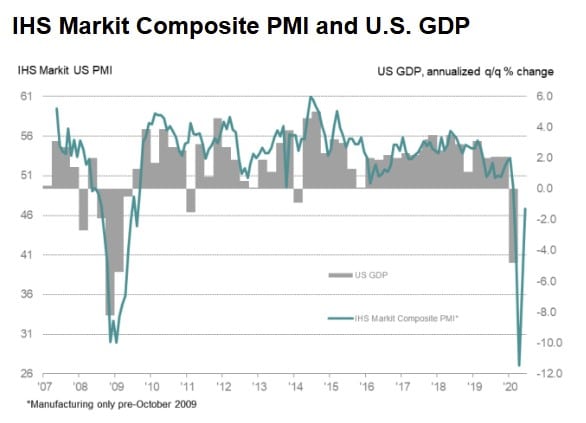
- Preliminary PMI Figures: PMI figures were at a 4-month high: Flash U.S. Composite Output Index at 46.8(37.0 in May). Flash U.S. Services Business Activity Index at 46.7(37.5 inMay). Flash U.S. Manufacturing PMI at 49.6(39.8 in May). Flash U.S. Manufacturing Output Index at47.8(34.4 in May).
- Durable Goods: According to the US Census Bureau, New orders for manufactured durable goods in May increased $26.6 billion or 15.8 percent to $194.4 billion.
- Richmond Fed Manufacturing Index: The composite index rose from −27 in May to 0 in June, as shipments were relatively flat, more firms reported increases in new orders, and firms generally reported continued declines in employment.
- Jobless Claims: In the week ending June 20, the advance figure for seasonally adjusted initial claims was 1,480,000, a decrease of 60,000 from the previous week’s revised level. However, the pace of decrease remains slow.
Oil Market
The oil market has also been feeling some pressure, dragged by virus fears and weekly oil reports:
- The API reported an increase of 1.75 million barrels on Tuesday
- EIA weekly report posted a 1.4 million increase in crude oil inventories.
However, the oil market is finding support on surveys and data showing a pick up in activities that will fuel demand for oil. As of writing, WTI Crude oil (Nymex) and Brent Crude (ICE) are consolidating around $39.15 and $41.55, respectively.
Gold
Gold rallied at the start of the week as investors sought some safety given the resurgence of virus cases. After trading around the $1,780 mark, gold retreated dragged by a stronger US dollar. As of writing, XAUUSD pair is currently trading at $1,760.
By Deepta Bolaky
@DeeptaGOMarkets
Key Upcoming Events
- Core PCE, Personal Income & Spending and Michigan Consumer Sentiment Index (US)
| Monday, 29 June 2020 Indicative Index Dividends Dividends are in Points |
||||||
| ASX200 | WS30 | US500 | US2000 | NDX100 | CAC40 | STOXX50 |
| 7.616 | 0 | 0.376 | 0.501 | 0.402 | 7.602 | 2.478 |
| ESP35 | ITA40 | FTSE100 | DAX30 | HK50 | JP225 | INDIA50 |
| 14.351 | 0 | 0 | 0 | 0 | 30.335 | 0 |
Disclaimer: Articles and videos from GO Markets analysts are based on their independent analysis. Views expressed are of their own and of a ‘general’ nature. Advice (if any) are not based on the reader’s personal objectives, financial situation or needs. Readers should, therefore, consider how appropriate the advice (if any) is to their objectives, financial situation and needs, before acting on the advice. For more information on trading, check out our CFD trading courses.

Next: Reversals of Lockdown Easings?
Previous: Weekly Summary: Rising Virus Cases and Growing Fears of a Second Wave