- Home
- News & Analysis
- GO Daily News
- COTD: EURJPY – Loss Of Momentum Weighs Heavy
COTD: EURJPY – Loss Of Momentum Weighs Heavy
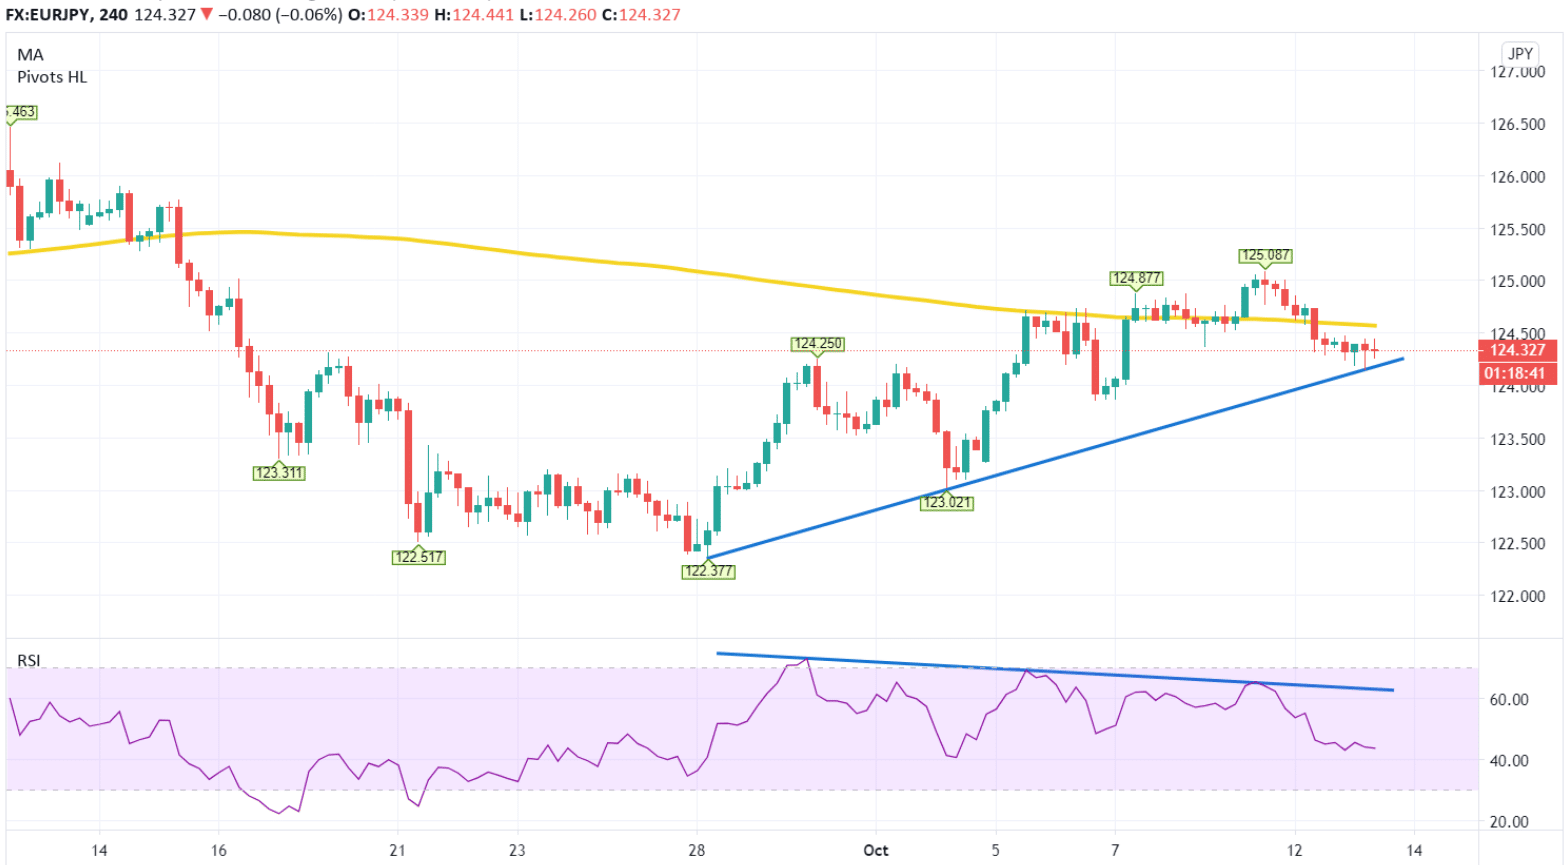
October 13, 2020EURJPY – 4HR


EURJPY-
Renewed selling interest in the EURJPY pair looks as if it may continue to lower levels during the upcoming sessions as the previous bullish technicals begin to waver.
The four-hour chart above shows a validated bullish trendline that originated towards the end of last month. Current support for this trendline sits at 124.30, and providing the price can stay above here, then the pair will remain bullish.
However, price action appears to be somewhat shaky with multiple failed attempts to break above the 200 MA line in yellow and a general loss of momentum as we see the shorter bursts of demand closer to the 125.08 high. We also have signs of some bearish divergence as displayed by the RSI indicator, and while the pair currently leans towards the oversold camp, there is still plenty of room for sellers to push this level further.
As mentioned earlier, the pair will need to hold above the 124.30 regions to keep within bullish sentiment. Otherwise, we could see EURJPY slip back down to 123.00 and 122.37, respectively.
Note: Click on charts to enlarge.
By Adam Taylor CTEe
 .
.Sources: Go Markets, Meta Trader 5, TradingView, Bloomberg
Disclaimer: The articles are from GO Markets analysts, based on their independent analysis or personal experiences. Views or opinions or trading styles expressed are of their own; should not be taken as either representative of or shared by GO Markets. Advice (if any), are of a ‘general’ nature and not based on your personal objectives, financial situation or needs. You should therefore consider how appropriate the advice (if any) is to your objectives, financial situation and needs, before acting on the advice. If the advice relates to acquiring a particular financial product, you should obtain and consider the Product Disclosure Statement (PDS) and Financial Services Guide (FSG) for that product before making any decisions.

Next: Overnight on Wall Street: Tuesday 14 October 2020
Previous: Overnight on Wall Street: Tuesday 13 October 2020