- Home
- News & Analysis
- GO Daily News
- Overnight on Wall Street: Tuesday 20 October 2020
Overnight on Wall Street: Tuesday 20 October 2020
October 19, 2020By Deepta Bolaky
@DeeptaGOMarkets
Equity Markets
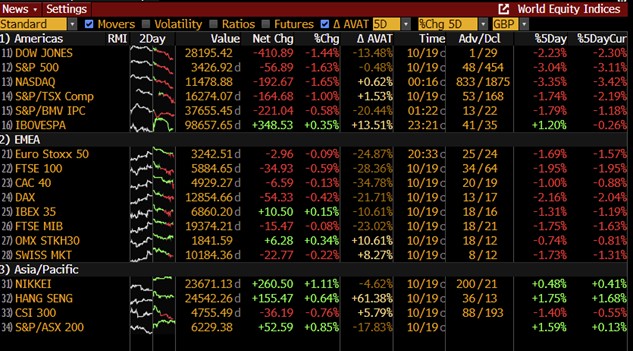
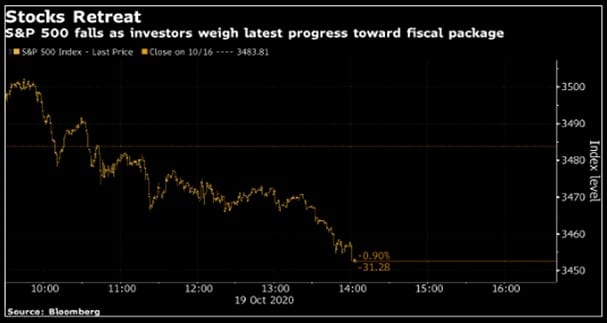
Global equities struggled to advance higher as investors mulled US stimulus negotiations. European stocks initially brushed aside coronavirus lockdown restrictions in certain parts of Europe and pared gains as the reality of the state of coronavirus relief negotiations in the US showed no progress ahead of the self-imposed deadline by the Democrats.
Major equity indices in the European and US session ended in negative territory on Monday.
Source: Bloomberg
The US election and stimulus package remain the key themes for the US markets. Given that negotiations around the stimulus package are still murky, investors will look for the outcome of the election which is heavily tied with the expectations of the size of the stimulus package:
- The Dow Jones Industrial Average lost 411 points or 1.44% to 28,195.
- S&P 500 fell by 57 points or 1.6% to 3,427.
- Nasdaq Composite erased 193 points or 1.7% to 11,479.
On the earnings front, International Business Machines (IBM) reported strong cloud revenue growth, gross margin expansion, solid balance sheet and liquidity position which was in-line with expectations. However, the company’s share price fell in extended trading hours as revenue was down by 2.6% which marks a fall for the third consecutive quarter on an annualised basis:
- Operating Earnings: $2.58 per share
- Revenue: $17.56 billion
On Tuesday, among a series of large-cap companies reporting their quarterly updates, investors will eye Netflix Inc third-quarter 2020 financial results.
Currency Markets
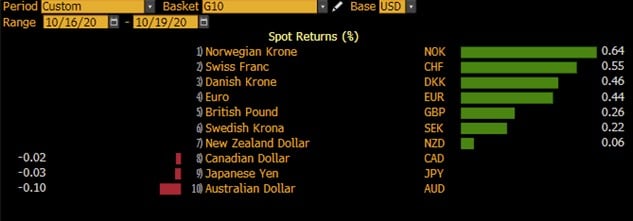
In the FX space, the US dollar has a difficult start to the week as traders were set on the stimulus negotiations. However, as the day comes to an end, traders noted continued narrow differences ahead of the deadline set by Democrats. The greenback pared losses and major currencies ended weaker than the safe-haven currency.
Commodities- related currencies were among the worst performing currencies against the US dollar.
Source: Bloomberg
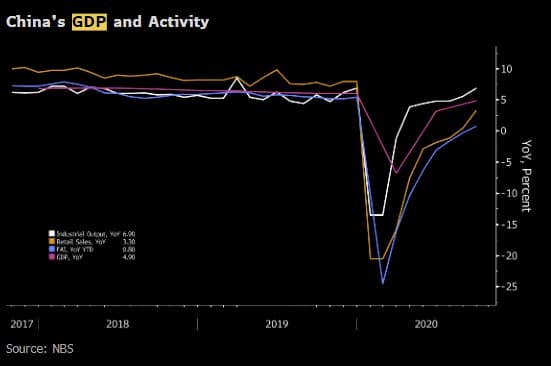
On the economic front, attention was on China’s economic data and GDP figures. China’s GDP grew 4.9% in this third quarter, missing the estimates of 5.2%. However, it was another quarter of expansion even though it was at a slower pace than expected.
Industrial Production and Retail Sales came above expectations:
- In September, the total value added of the industrial enterprises above the designated size grew by 6.9% year on year, growing for the sixth consecutive month, or 1.3 percentage points faster than the growth of August, with the month-on-month growth registering 1.18%.
- In September, the total retail sales of consumer goods reached 3,529.5 billion yuan, up by 3.3% year on year, 2.8 percentage points faster than that of August, maintaining the growth for two consecutive months.
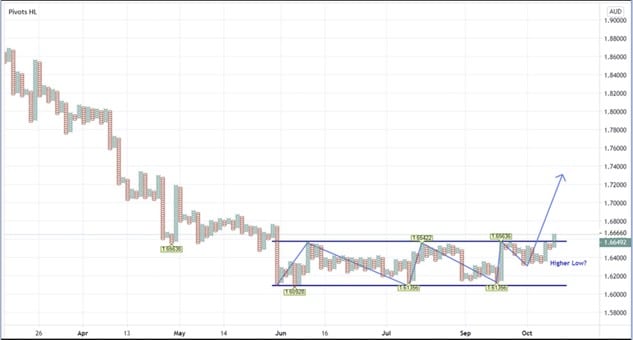
For the chart of the day, Adam Taylor takes a look at the EURAUD pair
The EURAUD pair has bubbled along since June without providing a clear directional bias. The price, caught within a range, has looked static and uninteresting, but that could all be about to change as we study the point and figure levels above.
Firstly, the price action itself may be suggesting a switch to an overriding bullish move to cap off this long period of consolidation. Note how we’ve seen several tests of linear support and resistance throughout this range until now. It would seem EURAUD may have just printed a higher low to push the price in an upward trajectory.
Just this afternoon, we see demand generating a buy signal as demand surged past the double-top at 1.6563. Of course, this could well be a false breakout, and the price may once again dip towards the 1.61 regions. However, combine this signal with the possibility of a new higher low, and it starts to paint a more bullish outlook.
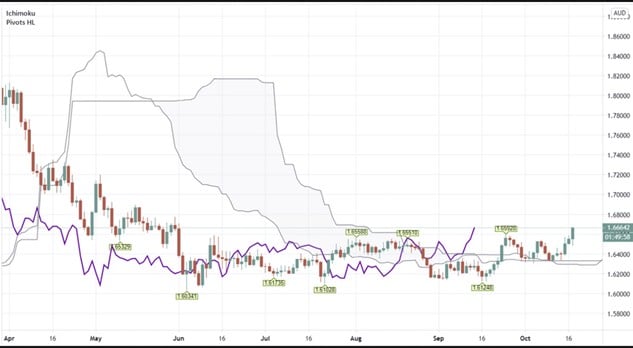
If we also take a look at the daily Ichimoku chart for EURAUD below, the price is now above the cloud, along with the longer-term lagging span line in purple. Both of these elements indicate a strong bullish sentiment. This chart may also help explain why the pair has struggled these past few months with directional bias, as price action fought its way through choppy cloud support and resistance.
Back to the point and figure chart and should EURAUD continue to rise, nestled upside targets are within the 1.70-1.72 area. Alternatively, the whole continuation move might still have some juice to squeeze, and in this scenario a re-test of the 1.61 level to complete the next price swing down is probable.
Commodities
Crude oil prices remained within familiar levels on Monday. Given the forecasts on the demand side, there is also increasing pressure from OPEC members and its allies to balance the supply side and avoid flooding the oil market with extra supply.
The demand side narrative continues to remain the major concern following the renewed lockdown restrictions and social distancing measures in certain parts of the world. On the supply side, traders will likely continue to monitor the weekly oil reports for fresh trading impetus.
As of writing, WTI Crude oil (Nymex) and Brent Crude (ICE) were trading firmer at around $40.64 and $42.62 respectively.
 Gold
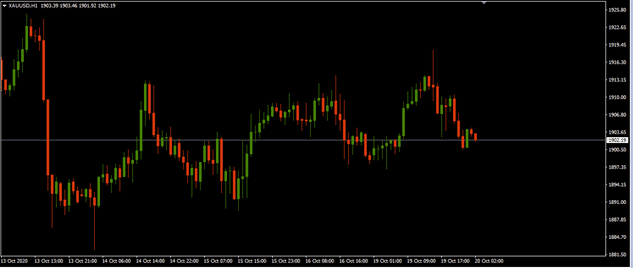
Gold
The precious metal remains stuck around the $1,900 in anticipation of more updates on the stimulus front. As of writing, the XAUUSD pair is trading around $1,902.
Source: GO MT4
By Deepta Bolaky

Key upcoming events
- NZIER Business Confidence and GDT Price Index (New Zealand)
- RBA’s Kent Speech and Meeting Minutes (Australia)
- PBoC Interest Rate Decision (China)
- Producer Price Index (Germany)
- Building Permits, Housing Starts and Fed’s Quarles Speech (US)
| Wednesday, 16 October 2020 Indicative Index Dividends Dividends are in Points |
||||||
| ASX200 | WS30 | US500 | US2000 | NDX100 | CAC40 | STOXX50 |
| 0 | 0 | 0.08 | 0.009 | 0 | 0 | 0 |
| ESP35 | ITA40 | FTSE100 | DAX30 | HK50 | JP225 | INDIA50 |
| 0 | 0 | 0 | 0 | 0 | 0 | 0 |
Disclaimer: The articles are from GO Markets analysts, based on their independent analysis or personal experiences. Views or opinions or trading styles expressed are of their own; should not be taken as either representative of or shared by GO Markets. Advice (if any), are of a ‘general’ nature and not based on your personal objectives, financial situation or needs. You should therefore consider how appropriate the advice (if any) is to your objectives, financial situation and needs, before acting on the advice. If the advice relates to acquiring a particular financial product, you should obtain and consider the Product Disclosure Statement (PDS) and Financial Services Guide (FSG) for that product before making any decisions.
Next: DXY – Can The Dollar Rise To The Occasion?
Previous: COTD: EURAUD – Buy Signal To End Choppiness?

