- Home
- News & Analysis
- Trading Strategies, Psychology
- The Stochastic as an Alternative to RSI (Relative Strength Index) for Trading Decision Making
The Stochastic as an Alternative to RSI (Relative Strength Index) for Trading Decision Making
November 19, 2019
Ideally, as traders, our aim is often to identify potential entries at the start of a new trend (so “first in the queue”) and exit at the end of that trend. Of course, we often will identify a price move where a trend may already be established and are therefore faced with the decision as to “join in” mid-trend (we hope) with the aim of catching the rest of a trend move.
The concern of this approach is of course the fear of potentially entering just prior to that trend changing. There are “clues” we can use, such as candle body/wick size and volume which may help, but also there is a group of indicators termed ‘oscillators’ which work on the idea that there are points in a price move which the underlying asset (be it a Forex pair or CFD) may be overbought (and hence a long trade could be deemed riskier), and oversold (where a short trade may be termed riskier).
Although the Relative Strength Index (RSI) which we covered previous in an article (review “Adding the RSI to your entry or exit trading plan?“), is possibly a more commonly used oscillator for determining oversold and overbought situations, the stochastic although possibly seen as being slightly more complex, does appear to be frequently used by more experienced traders.
This article aims to shed some light on how this indicator is used and what it may be showing you relative to price movement.
What is the stochastic trying to tell us?
As with the RSI the Stochastic is an oscillator (whose value can theoretically lie between 0-100) which has identified key levels which may indicate whether a particular asset is overbought or oversold. A move into either of these two “zones” may suggest a trend change is more likely to be imminent.
The key levels are below 20 (oversold) and above 80 (overbought).
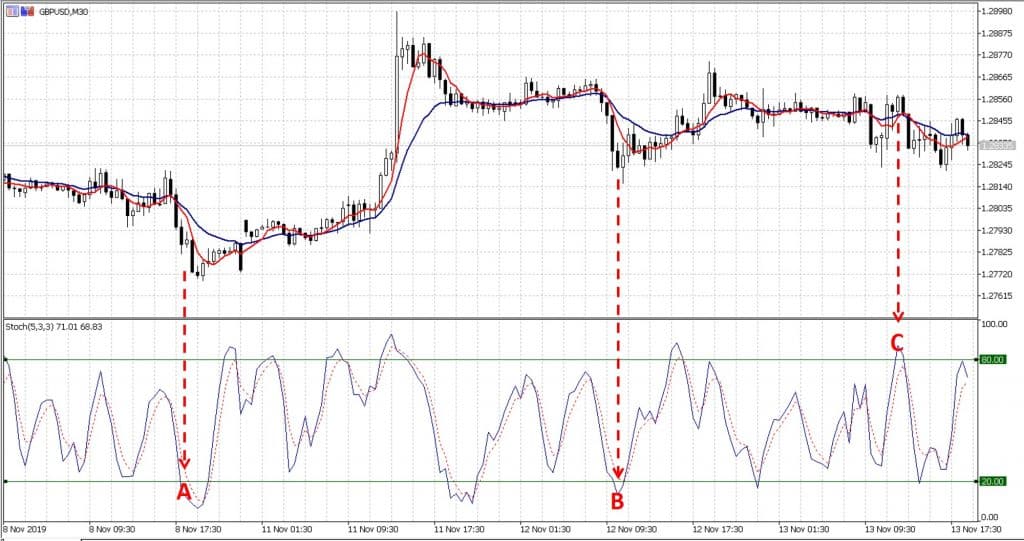
See below a 30-minute chart for GBP/USD with the stochastic added using the default system settings (we have added horizontal lines from the drawing tools to make the key levels clearer.
We will discuss settings later and the additional line but at a simple level, taking the blue line on the stochastic if it moves below 20, then you would be cautious and perhaps avoid entering a short trade (examples A and B), and perhaps avoid entering a long trade if it moves above 80 (see example C).
And the other dotted line?
There are two lines that form the stochastic namely:
- %K (usually a solid line) – In this case blue as previously referenced above.
- %D (usually a dotted line) and is a moving average of %K (often set as an exponential)
Slowing periods may also be set (default is 3). As a rule, the slower (bigger number the less “noisy” i.e. you will see less overbought and oversold conditions).
And how can it be used?
a. As an additional entry criteria “tick”
As referenced earlier, for entry, traders may use this as an additional tick (when other indicators may suggest entry) to make sure they do not enter a long trade on an overbought currency pair/CFD, or short trade on an oversold currency pair/CFD.
b. As a warning to prepare for exit action in an open trade
Though less commonly discussed, it would appear logical that if in a long trade for example and the Stochastic moves into an over-bought position this could be a warning to consider exit (more commonly used as a signal to tighten a trailing stop loss)
c. As a primary reversal signal
Additionally, some traders may look to buy when moving out of an oversold situation when the EMA dotted line crosses the solid blue line. (and of course, the reverse when overbought).
It would be rare to use this in isolation with no other indicators, using increasing volume, and candle change recognition would often be used also.
The relatively fast default settings (5,3,3) may merit some review anyway but particularly in this case.
Which settings?
As with any indicator you are in control of the settings and what you use for you is of course your choice.
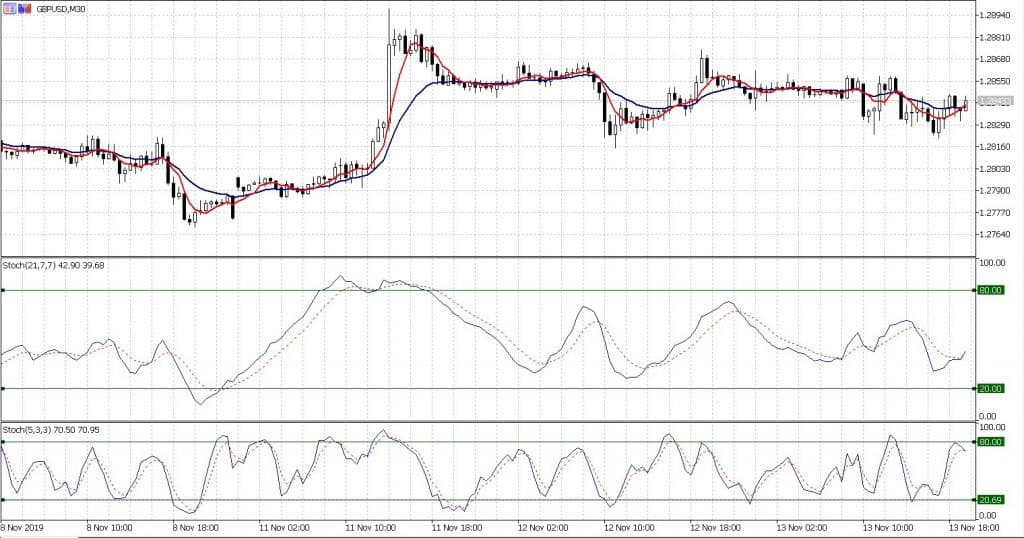
With the chart below, we have used the default 5,3,3 and added a 21,7, 7 to illustrate the difference of a less noisy set of perimeters.
In Summary
Ultimately, and to finish, it is of course your choice as to which criteria you use for entry and exit.
Remember, whatever these are for you, the key lessons of:
a. specifically identifying how you are to use the criteria within your plan,
b. the importance of forward-testing (as well as back-testing) of any system change,
c. and of course, the discipline of following through
are ALL critical whether you use the Stochastic, RSI or neither.
Mike Smith
Educator
GO Markets
Disclaimer
The article from GO Markets analysts is based on their independent analysis. Views expressed are of their own and of a ‘general’ nature. Advice (if any) are not based on the reader’s personal objectives, financial situation or needs. Readers should, therefore, consider how appropriate the advice (if any) is to their objectives, financial situation and needs, before acting on the advice.
Next: US share or option trader: Managing currency risk?
Previous: 10 Ways to Manage Your Trading Psychology – a Blueprint for Development


