- Home
- News & Analysis
- Trading Strategies, Psychology
- The 200-Day Moving Average
The 200-Day Moving Average
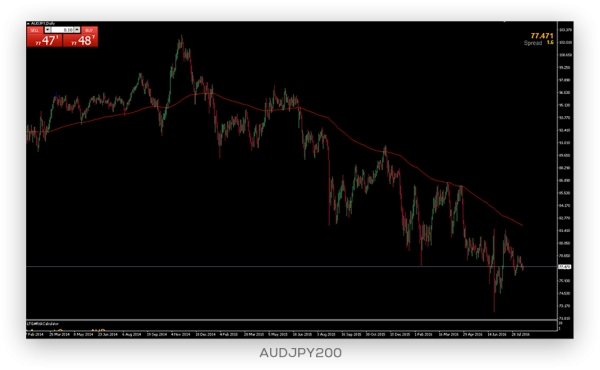
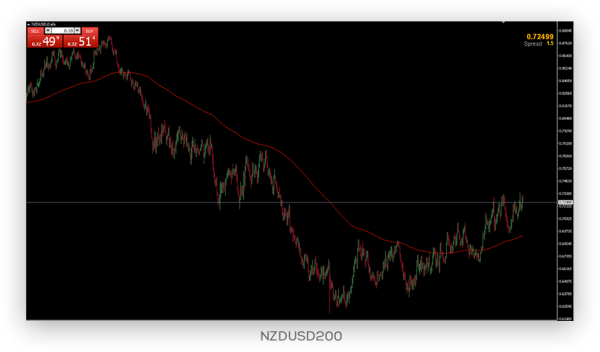
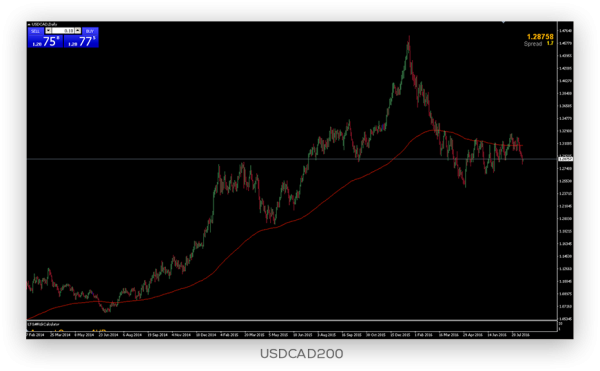
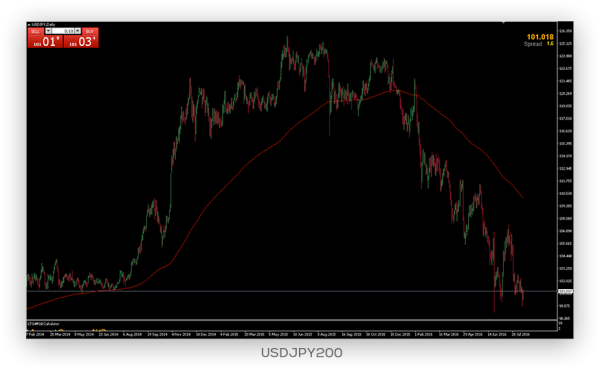
August 17, 2016One of the worlds most profitable Hedge Fund Managers Paul Tudor Jones called it in Tony Robbins Money Master Book “my #1 Trading indicator ” and some of my colleagues in institutions and banks have referred to it as a key barometer for where substantial money flow often occurs. I am referring to the 200-Day Moving Average on a Daily chart and as the charts will demonstrate below the 200 MA (moving average) not only has the potential to reverse a currency market but can also be a general guide to where the overall trend is.
So how can you use the 200 MA to potentially improve your strike rate in the currency markets? It is generally viewed by most professional traders that if price is above the 200 MA they will not attempt to short a currency and will generally only look to use their trading system to buy into the market they are trading. The opposite when price is below the 200 MA, they will generally look to only short the currency pair they are trading.
Trading systems that appear to have an edge on a higher time frame such as a 4-hour or daily chart can potentially be enhanced by applying this rule of thumb.
Following are 4 charts showing the 200 MA on a Daily Chart. If you’d like to apply a 200 MA to your MT4 platform simply go to the Menu at the top of the page, click on Insert, then click on indicators and then trend. You will see Moving Average listed there for you to click on and load. Make sure you input 200 into the Period box under Parameters.
|
Next: Why Thinking in 10’s could help you as a trader
Previous: Top Candlestick Patterns and How to Use them in Your Trading


