- Home
- News & Analysis
- Oil and Metals
- Lacklustre Gold Weighing Heavy On Markets
Lacklustre Gold Weighing Heavy On Markets
August 7, 2018Free-falling gold prices
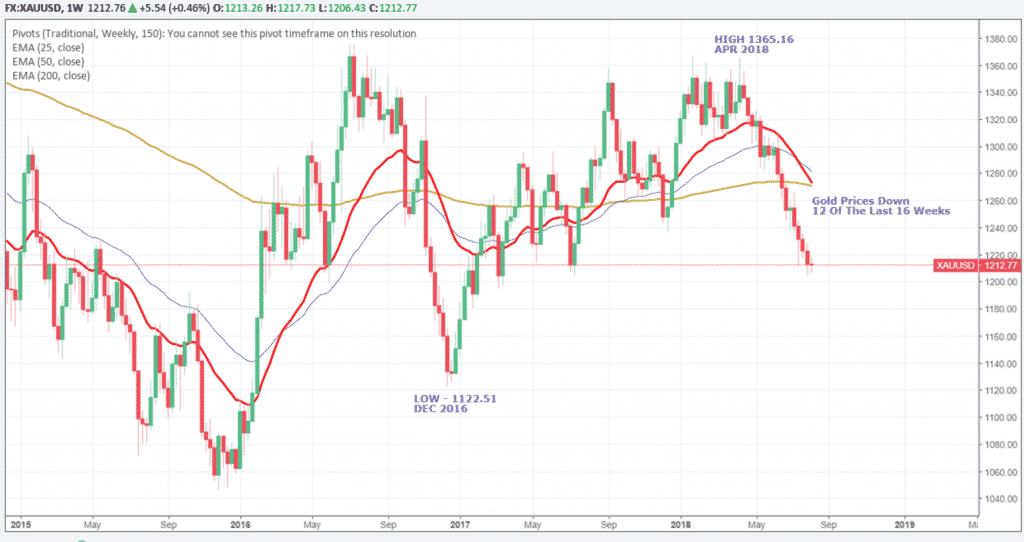
The latest weekly chart for gold does not look favourable for the precious metal. Below we can see that in twelve of the past sixteen weeks, gold prices have ended down and is one of the worst runs for the metal in decades.
What is surprising is that the demand for gold continues to fall despite an increasingly volatile geopolitical situation unfolding between the US and China. If anything, the US Dollar appears to be getting stronger as tensions grow, and as a result gold is feeling the pinch. Given the circumstances, we would expect the opposite for XAUUSD.
So what are the possible causes for the loss of interest in this market? In short, we have so many elements at play here that it would be difficult to pinpoint any one reason. However, as follows, there are a few standout factors which deserve mentioning.
Overall Demand
According to the World Gold Council, we saw a total demand of 1,959 tonnes during the first half of the year. This amount is the lowest level since 2009, and a further 2,086 tonnes less than the previous year.
Rates Hikes
Let’s also not forget that the Federal Reserve has lifted interest rates twice this year, and plans further additional raises towards the end of the year. This news alone would typically put pressure on gold and silver prices. It does pose an interesting question though; what if the two remaining rate hikes predicted for 2018 is already fully priced into the market? Given the media hype surrounding the policy decisions, it would make sense that many have considered this aspect before the recent drop. In short, there isn’t much scope for a surprise, so it becomes hard to rationalise this latest activity based on this evidence alone.
Investor Sentiment
Another factor could be the onwards and upwards march of US equities. Market sentiment currently favours the equities asset class which makes it a more appealing place to invest capital than metals. This mostly risk-on sentiment keeps driving US stocks higher, despite Washington’s woes elsewhere around the globe. So, with the focus squarely on equities, it’s perhaps not a great shock that gold is suffering, as investors will generally flock to the highest yields. Unfortunately, gold as a non-interest bearing asset will always come off second best in this scenario.
Of course, we also have gold stocks, or more commonly, gold ETF’s (Exchange Traded Funds) which are increasingly becoming the popular method of gaining exposure to the metal. Although, these types of investments appear to have only made things worse as US investors have started shuffling gold ETF funds into other sectors. Perhaps the biggest clue is that ETF’s purchased only 60.9m tonnes of gold in the past six months, versus 160.9 tonnes during the same time last year.
Technicals
As shown on the previous weekly chart, the technicals are noticeably bearish longer-term. Gold prices are grinding lower to the psychological support level of $1,200 per ounce.
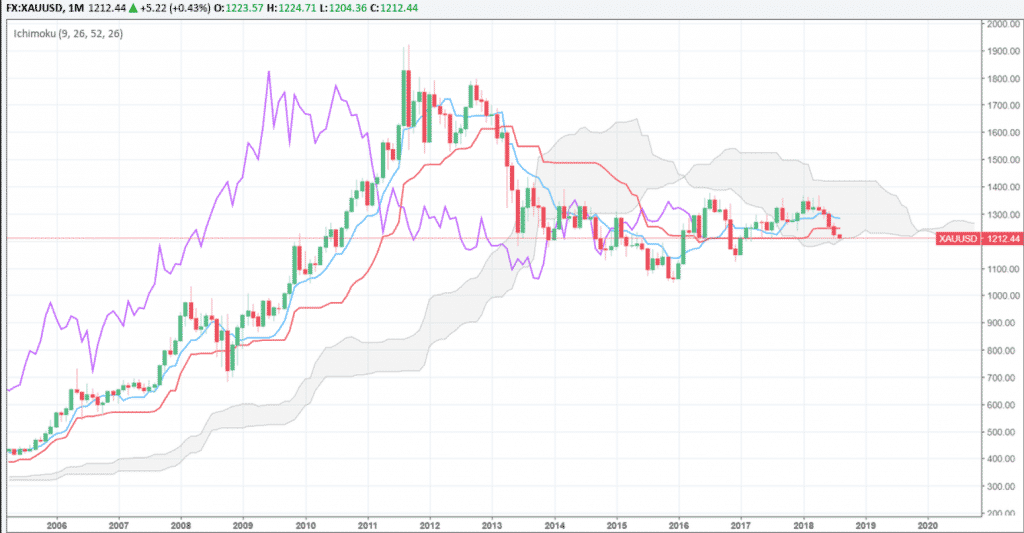
Sticking with the longer-term view, if we study the Ichimoku monthly chart above, you’ll notice that the $1200 level coincides with the bottom of the cloud formation. I see this going either one or two ways; perhaps we will see the price rebound off this mark and attempt another move towards the $1300 region, or, the slide will turn into an avalanche as the price gravitates towards the $1122.51 lows that were seen in December 2016. Should we see a close below $1200, I suspect this level will turn to an area of resistance and stifle movement in the short-medium term.
As long as the US Dollar holds its ground and investors continue to cherish equities over other asset classes, we will likely see further pressure on gold, silver and commodity trading markets as a whole.
By Adam Taylor CFTe
This article is written by a GO Markets Analyst and is based on their independent analysis. They remain fully responsible for the views expressed as well as any remaining error or omissions. Trading Forex and Derivatives carries a high level of risk.
Next: Global Oil Sentiment May Assist The Loonie
Previous: Snapshot – AUDNZD, EURUSD, USOIL


