- Home
- News & Analysis
- Geopolitical Events
- Why Brexit is Not a Black Swan
Why Brexit is Not a Black Swan
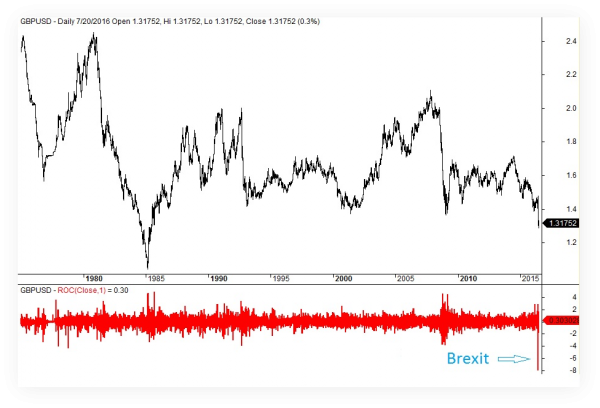
July 28, 2016The 7.95% downward move on the British Pound (GBP) on the back of the Brexit vote was definitely one of a kind.
The black line in the chart below shows the daily closing prices for the cable all the way back to 1975. The red line is the daily net changes (measured from close to close) during the same period. As you can see, never in the past 41 years have we seen a daily move like the one that occurred on the 24th of June 2016.
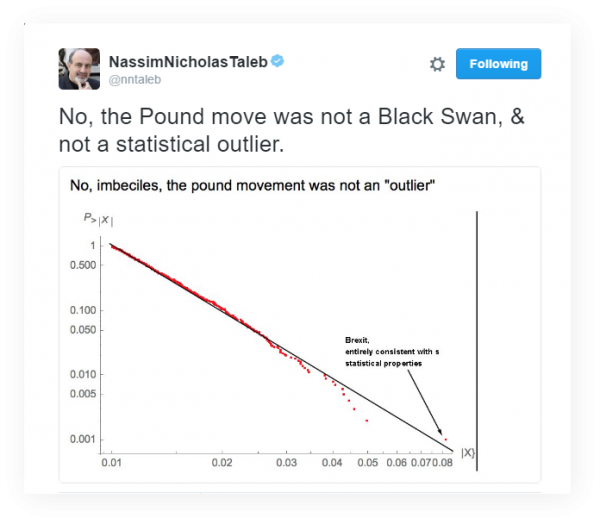
Despite the uniqueness and magnitude of such a move, many analysts, led by the famous financial mathematician and author of “Fooled by Randomness” and “Black Swan” (which are both highly recommended for serious traders) , Nassim Taleb , believe the Brexit move was within the boundaries of statistical properties, which is another way of saying it was not an outlier.
Nassim Taleb’s Twitter account a few days after Brexit:
Regardless of how you chose to see the Brexit events, in this article I am going to crunch some numbers to see if such extreme price actions can potentially have any explanatory power that can be used by medium and short term traders.
Analysis of GBP returns from 1975 – 2016
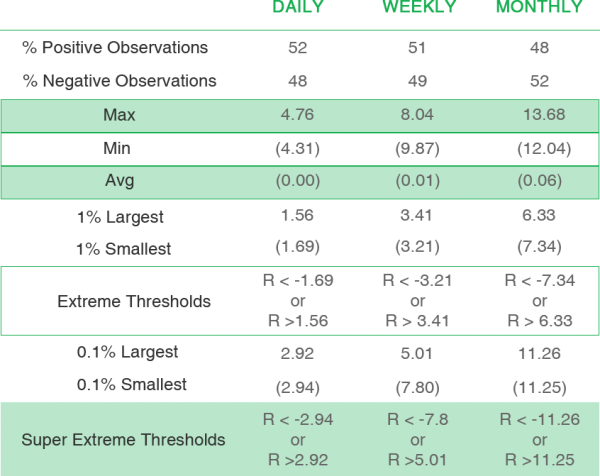
For this analysis, I first needed to define what makes a price change normal and what makes it extreme. To do this, I gathered the daily, weekly and monthly returns for the cable since 1975 to today (excluding the Brexit day) and constructed the table below.
This table shows some of the statistical attributes of the cable over the study period. For example, under the Daily column, you can see that historically 52% of the times the Pound has had a positive return and 48% of the times it has seen price depreciation on a day to day basis.
Furthermore, this table shows that the average of positive and negative returns across all time frames is around zero. This is quite normal and holds across many markets (including stock indices) and goes to show how difficult it is to predict the direction of the market.
From here, I want to draw your attention to where it says “1% largest”. These are the returns that have only occurred 1% of the times and have all been equal or greater than the number that appears in front of them. For example, the under the daily column, it says that only 1% of the times, the sterling has recorded a daily gain of 1.56% or more.
Said differently, this line item shows that 99% of the times, the daily Pound return has been less than 1.56%. On the flip side, the “1% smallest” means that only 1% of the times, the GBPUSD has dropped more than 1.69% a day which is the same as saying that 99% of the times, the Pound’s daily return has been greater than -1.69%.
From these two lines, I constructed the “Extreme” range which is one of the thresholds used for this analysis. An extreme day is when a daily return is either greater than 1.56% or less than -1.69%. If a daily return falls between those ranges mentioned in the above, then I call that a normal day.
Please note that just because of the way I have defined my normal range, I expect 98% of the times the Pound’s daily return falls in the normal range. You can extend the same terminology for the weekly and monthly returns.
For example, looking at the monthly range, if any one month’s return is between -7.34% to 6.33%, you can call that month a normal month. However, if it moves outside of those limits, then that is going to be an extreme month.
The last line in the table above shows another range which I call the Super Extreme range. These are the observations that have only happened 0.1% of the times. For example, for a daily return to be superextreme, it has to be either greater than 2.92% or less than -2.94%.
Now that we have established the thresholds, let’s turn our attention to the Brexit. The table below shows sterling’s return on the Brexit day, week and month.
As you can see from the table above, Brexit was an extreme move in all time frames. However, with the exception of daily prices it cannot be accounted as a super extreme move.
Analysis of GBP’s extreme moves
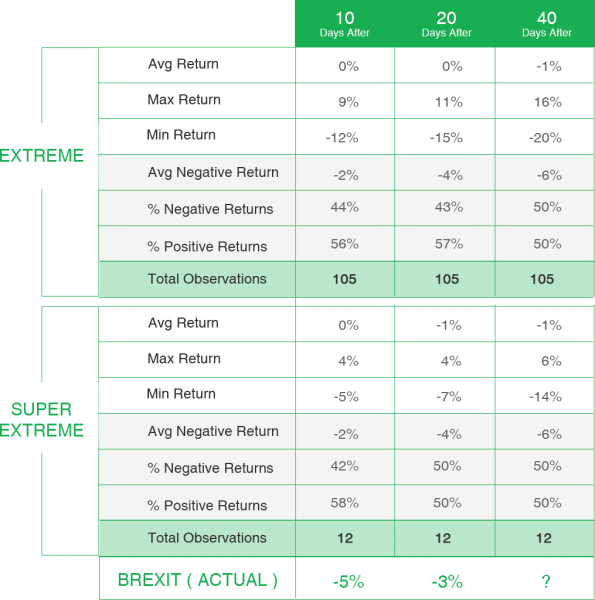
Now let’s turn our attention to the negative extreme moves and see what’s happened each time the cable has come across such extreme moves in the daily, weekly and monthly time frames.
The results for the daily observations are reported in the following tables. As you can see under both extreme and super extreme scenarios, the market has usually bounced back in the first 10 days, and from there onwards the future direction of the market over the next 20 and 40 days has been a 50-50 game. Therefore, it appears that purely based on the historical daily data, we cannot draw any meaningful conclusion from an excessive down day.
Daily Performance
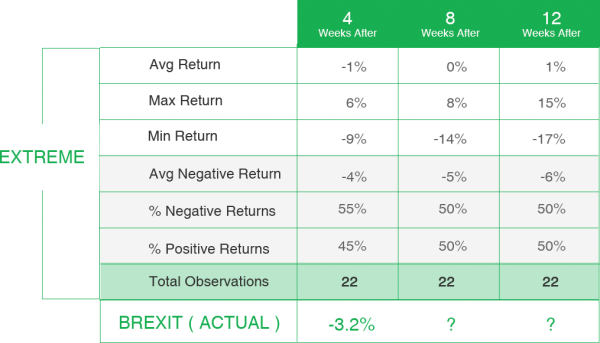
Next I looked at the weekly data and summarised the required information in the table below. As you can see, there is a bit of an edge in the first 4 weeks after a large negative event. According to this table, 55% of the times the Pound has resumed its downward trend 4 weeks after an extreme negative event with an average price fall of -3.7%.
From there onwards, the model does not have much to say.
Weekly Performance
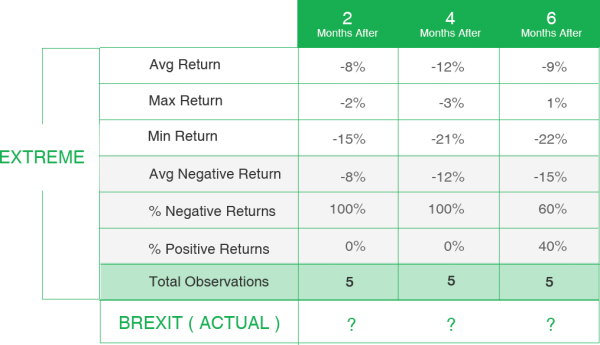
Looking at the monthly data, things start looking much better. According to the table below, in 100% of the times, once the sterling posts a negative extreme month, it continues downwards for the next 4 months where it drops by an average of 12.3%.
Monthly Performance
While the above finding is great and shows a future direction with a notable profit potential for medium term short sellers, it comes with a catch. If you look at where it says “Total observations”, you will notice that there have only been five cases in the entire study period where the Pound has posted an extreme negative monthly return. So our sample size is too small.
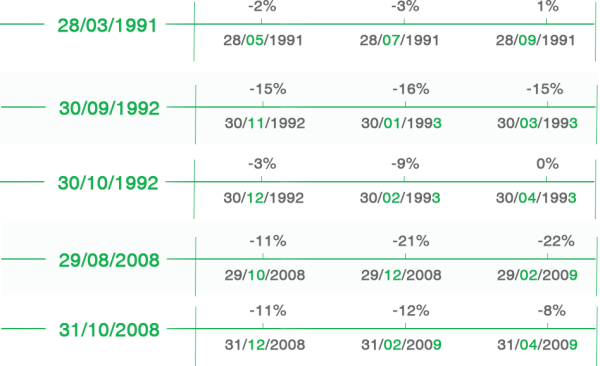
What makes the matter worse is when you realize that all of these five cases are either in relation to the Pound crash in 1992 or GFC in 2008. Therefore, unless you believe the GBPUSD is fundamentally in the same situation (1992 or 2008), then it would be really hard to draw a meaningful comparison.
Extreme Monthly negative returns since 1975
Beware of extreme price actions
Based on the information provided in this analysis, unless you believe that the UK is in a similar situation today compared to where it was in 1992 or GFC, drawing conclusions based on outliers or extreme price actions seems to be a risky business.
Also in a more generic term, it appears that extrapolating past events in the daily (higher) frequency is less informative compared to when lower frequency (i.e, monthly data) are brought to the picture.
The third point that I want to make is that big one day or one period moves should not be the basis of your trading systems. They may look compelling, but when you do some simple objective tests, they won’t pass.
Please note that trading Forex and Derivatives carries a high level of risk, including the risk of losing substantially more than your initial investment. Also, you do not own or have any rights to the underlying assets. You should only trade if you can afford to carry these risks. Our offer is not designed to alter or modify any individual’s risk preference or encourage individuals to trade in a manner inconsistent with their own trading strategies.
|
Next: What You Need to Know About Brexit – by Klavs Valters, GO Markets
Previous: Brexit Impact on Global Markets

